Accurate Brain Imaging Studies Require Large Sample Sizes
Brain-wide association studies (BWASs) use magnetic resonance imaging (MRI) data to correlate the brain’s structure and function with personality, behavior, thinking, neurological conditions, and mental illness. While MRI data has been extremely useful in brain mapping, it has been less successful in the areas of mental health research and care.
A new study by University of Minnesota researchers in collaboration with researchers from several other international groups shows that it is necessary to have very large datasets in order to have meaningful results. Studies using the small (~25 samples) datasets used for brain mapping can result in skewed results - incorrect associations can be drawn through chance, while real, but weaker, associations are missed. For this project, the research group used very large neuroimaging datasets, with a total sample size of around 50,000 individuals. As the sample sizes grew, the problems associated with using smaller sizes were reduced and replication rates improved.
The study was published in the prestigious journal Nature and can be found on the journal website: Reproducible brain-wide association studies require thousands of individuals. An article about the study also appears as a University of Minnesota Research Brief: Brain studies show thousands of participants are needed for accurate results.
This study was co-led by MSI PI Damien Fair (Director, Masonic Institute for the Developing Brain (MIDB); Pediatrics; Institute of Child Development) and Nico U.F. Dosenbach (Washington University School of Medicine; Washington University in St. Louis). Co-authors on the paper from the University of Minnesota include:
Stephen M. Malone (Psychology; MSI PI)
Eric Feczko (MIDB; Pediatrics; MSI PI)
Oscar Miranda-Dominguez (MIDB; Pediatrics; MSI PI)
Eric A. Earl (MIDB)
Anders J. Perrone (MIDB)
Gregory M. Conan (MIDB)
Benjamin J. Lynch (MSI; MIDB)
James C. Wilgenbusch (Director, Research Computing; MSI; MIDB)
Thomas Pengo (Director of Applications and Services, UMII)
MSI and Research Computing staff work in partnership with MIDB on a number of projects that focus on mechanisms and principles that underlie the developing brain.
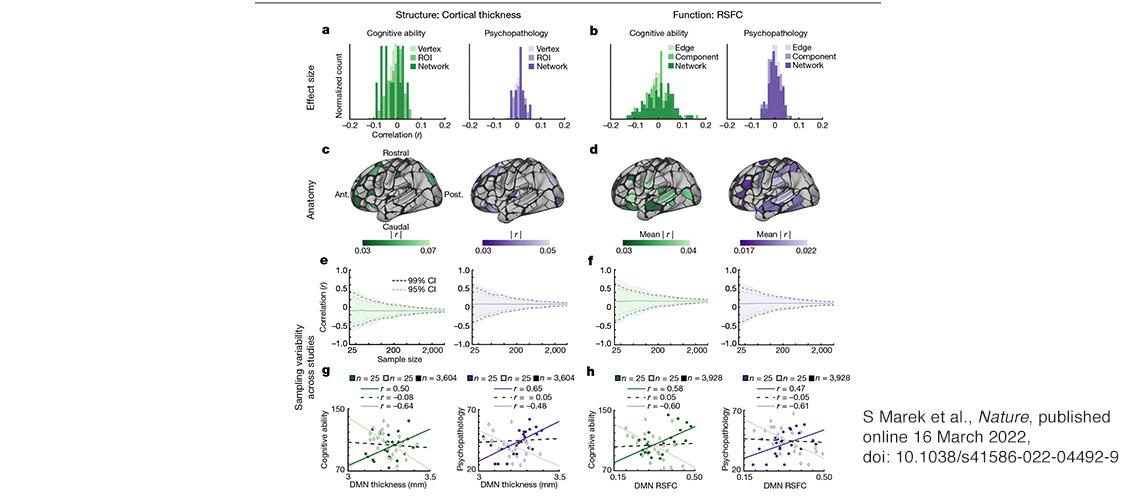
Image description: Effect sizes and sampling variability of univariate brain-wide associations. ABCD Study sample data (n = 3,928). a, b, Effect sizes were estimated using standard correlations (bivariate linear r). Brain-wide association histograms (normalized to per panel maximum bin) of cortical thickness with cognitive ability (left, green) and psychopathology (right, purple) at all levels of analysis (vertex, ROI and network; for separated levels of analysis see Supplementary Fig. 2a, b) (a), and RSFC with cognitive ability (left, green) and psychopathology (right, purple) at all levels of analysis (edge, network and component) (b). c, d, The largest brain-wide associations (ROI, top 10%) for cortical thickness with cognitive ability (left, green) and psychopathology (right, purple) (c), and RSFC with cognitive ability (left, green) and psychopathology (right, purple) (d). e, f, Sampling variability (1,000 resamples per sample size in logarithmically spaced bins: n = 25, 33, 50, 70, 100, 135, 200, 265, 375, 525, 725, 1,000, 1,430, 2,000, 2,800 and 3,604 (3,928 for cortical thickness)) of the largest brain-wide association for each brain–behavioral phenotype pair, for cortical thickness with cognitive ability (left, green) and psychopathology (right, purple) (e), and RSFC with cognitive ability (left, green) and psychopathology (right, purple) (f). Solid lines represent the mean across 1,000 resamples. Shading represents the minimum to maximum correlation range across subsamples, for a given sample size. Grey dashed line represents the 95% confidence interval and the black dashed line represents the 99% confidence interval. f, g, Examples of two n = 25 subsamples, in which inaccurate default mode network (DMN) correlations were observed for cortical thickness with cognitive ability (left, green) and psychopathology (right, purple) (g), and RSFC with cognitive ability (left, green) and psychopathology (right, purple) (h). Black dashed line denotes linear fit from full sample. Image and description, S Marek et al., Nature, published online 16 March 2022, doi: 10.1038/s41586-022-04492-9.