Desynchronization of Circadian Rhythms in ICU Patients
Circadian rhythms, which coordinate the sleep-wake cycle and have a roughly 24-hour period, are now known to be important to physical health. When these rhythms are desynchronized from the light-dark cycle, it can be an indicator of illness or even predispose a person to disease. Because of the unusual conditions - noise, unnatural light/dark cycles, constant activity - in intensive care units (ICUs), coupled with their illness, ICU patients can experience circadian desynchronization, which could affect their response to treatment.
Assistant Professor Elizabeth Lusczek (Surgery) led a team that included MSI PIs Greg Beilman (professor, Surgery) and Germaine Cornelissen-Guillaume (professor, Integrative Biology and Physiology; director, Halberg Chronobiology Center) in a pilot study that investigated rhythms in healthy subjects and in ICU patients. Using measurements of the subjects’ vital signs and metabolomic analyses of the subjects’ blood plasma, the researchers have found that the rhythms of ICU patients were considerably desynchronized. Primary component analysis of plasma metabolic profiles in ICU patients showed some surprising clustering patterns that varied from those of the healthy subjects. Further studies are necessary to find out implications for patient care. The paper was published in the journal Frontiers in Neurology: Elizabeth R. Lusczek, Lee S. Parsons, Jesse Elder, Stephen B. Harvey, Mariya Skube, Sydne Muratore, Greg Beilman, Germaine Cornelissen-Guillaume. 2020. Metabolomics Pilot Study Identifies Desynchronization of 24-H Rhythms and Distinct Intra-patient Variability Patterns in Critical Illness: A Preliminary Report. Frontiers in Neurology, 02 October 2020. doi:10.3389/fneur.2020.533915.
Professor Beilman uses MSI resources to analyze mass spectrometry data for several projects concerning various diseases. Professor Cornelissen-Guillaume uses MSI for analysis and organization of data generated by the Halberg Chronobiology Center. Co-author Dr. Lee Parsons, who performed data analysis for this paper, was a bioinformatics analyst in the Research Informatics Solutions group at MSI until November 2019.
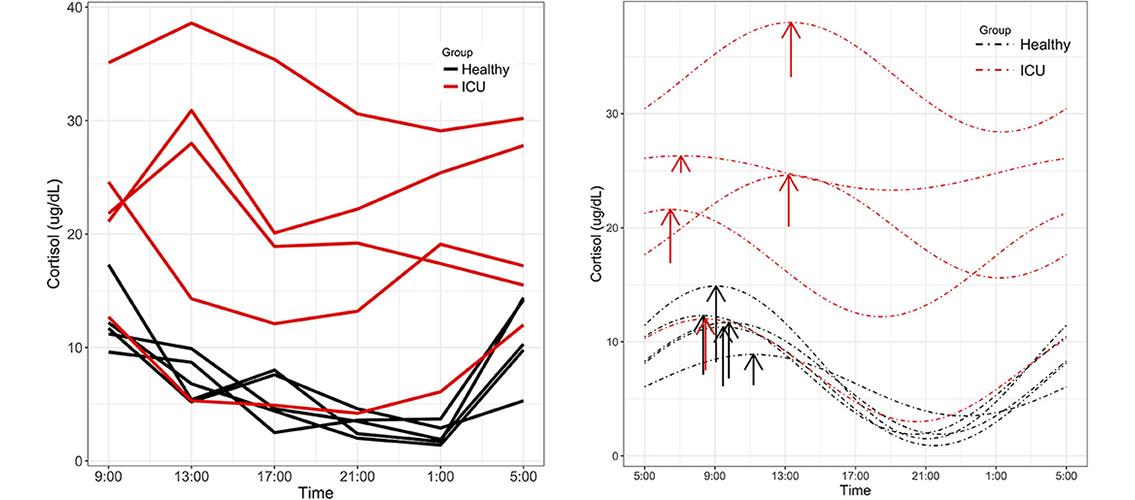
Image description: Cortisol rhythms. (Left) Individual time series plots of cortisol concentrations quantified by Fairview Hospital Laboratories. Red lines indicate measure cortisol concentrations in ICU patients and black lines indicate healthy controls. (Right) ICU patients showed alterations in MESOR and phase not present in controls. Dashed lines represent cosinor fits to the data. Arrows are placed at each rhythm’s acrophase. Arrow lengths reflect rhythm amplitude. Image and description, ER Lusczek et al., Front. Neurol., doi: 10.3389/fneur.2020.533915.